8.6. Important Continuous Random Variables#
import numpy as np
import scipy.stats as stats
import matplotlib.pyplot as plt

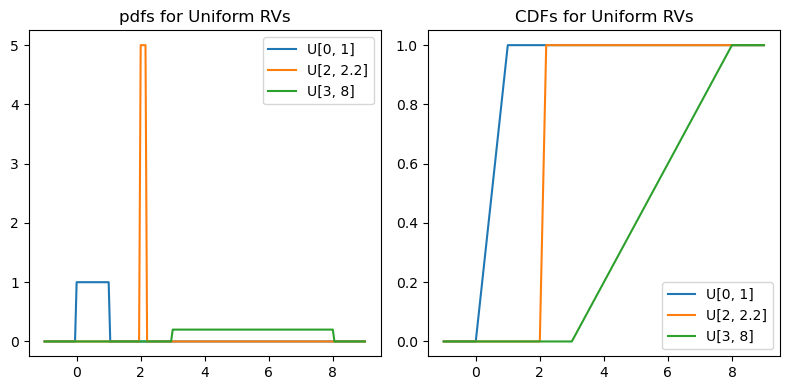
fig, axs = plt.subplots(1, 2, figsize=(8,4))

u = np.linspace(-1, 9, 201)
U1 = stats.uniform(0, 1)
U2 = stats.uniform(2, 0.2)
U3 = stats.uniform(3, 5)

ax=axs[0]
ax.plot(u, U1.pdf(u), label="U[0, 1]")
ax.plot(u, U2.pdf(u), label="U[2, 2.2]")
ax.plot(u, U3.pdf(u), label="U[3, 8]")
ax.legend()
ax.set_title("pdfs for Uniform RVs");

ax=axs[1]
ax.plot(u, U1.cdf(u), label="U[0, 1]")
ax.plot(u, U2.cdf(u), label="U[2, 2.2]")
ax.plot(u, U3.cdf(u), label="U[3, 8]")
ax.legend(loc='lower right')
ax.set_title("CDFs for Uniform RVs");

plt.tight_layout()

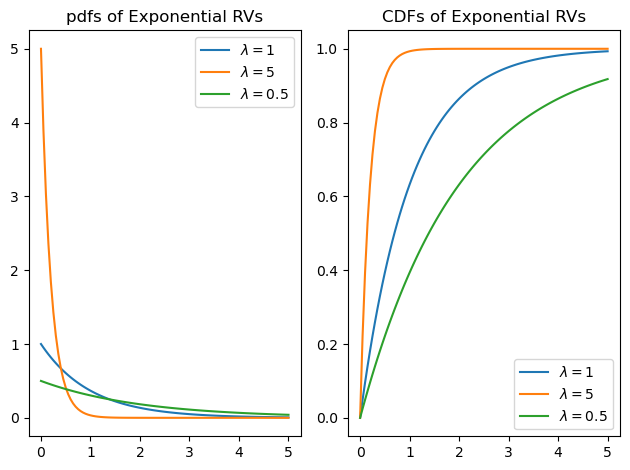
fig, axs = plt.subplots(1,2)

x = np.linspace(0, 5, 101)
lambdas = [1, 5, 1 / 2]

# Plot the pdfs
ax = axs[0]
for lam in lambdas:
    X = stats.expon(scale=1 / lam)
    ax.plot(x, X.pdf(x), label="$\lambda  = " + str(lam) + "$")

ax.legend()
ax.set_title("pdfs of Exponential RVs");

# Plot the CDFs
ax = axs[1]
for lam in lambdas:
    X = stats.expon(scale=1 / lam)
    ax.plot(x, X.cdf(x), label="$\lambda  = " + str(lam) + "$")

ax.legend()
ax.set_title("CDFs of Exponential RVs");

plt.tight_layout()

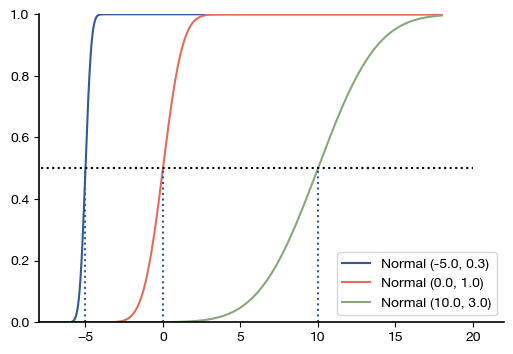
x = np.linspace(-8, 18, 1000)

all_params = [(-5, 0.3), (0, 1), (10, 3)]
for params in all_params:
    N = stats.norm(params[0], params[1])
    mylabel = f"Normal ({N.mean()}, {N.std() :.1f})"
    plt.plot(x, N.cdf(x), label=mylabel)

plt.plot([-10, 20], [0.5, 0.5], "k:")
plt.vlines([0, 10, -5], ymin=0, ymax=0.5, linestyles="dotted")
plt.xlim(-8, 22)
plt.ylim(0, 1)
plt.legend(loc=4)
#plt.title("CDFs for Normal densities");
plt.savefig('normal-cdfs.pdf', bbox_inches='tight')

8.6.1. Terminology Review#
Use the flashcards below to help you review the terminology introduced in this chapter. \(~~~~ ~~~~ ~~~~\)
